Explore Global External Debt with detailed analyses, regional insights, and country comparisons.

Introduction: A Dance With Global External Debt
External debt is a critical aspect of the global economy, representing the money borrowed by one country from foreign lenders. It encompasses government, corporate, and household borrowing and plays a vital role in financing growth and maintaining liquidity.
This article explores the landscape of external debt across various countries, revealing intriguing patterns and unique cases.
The world’s economy is like a grand orchestra, each country playing its part in a complex symphony. But what happens when the music is overshadowed by the looming shadow of debt?
In this melody of numbers, external debt takes center stage, weaving a tale of growth, risk, and global interconnectedness. Grab your ticket to this financial concert, and let’s explore the rhythm of global external debt.
Global Overview: A Colorful Palette of Numbers – Global External Debt
A Mosaic of External Debt
Like brush strokes on a canvas, countries paint a vivid picture of external debt. From the gentle hues of small economies to the bold splashes of financial giants, the external debts range from a whisper of zero to a thunderous 956 billion USD.
The analysis of external debt across 209 countries unveils a diverse picture. The external debts range from 0 to 956 billion USD, with an average of 145.17 billion USD. The per capita external debts vary from 0 to an astounding 846,000 USD, while the debt as a percentage of GDP ranges from 0% to 849%.
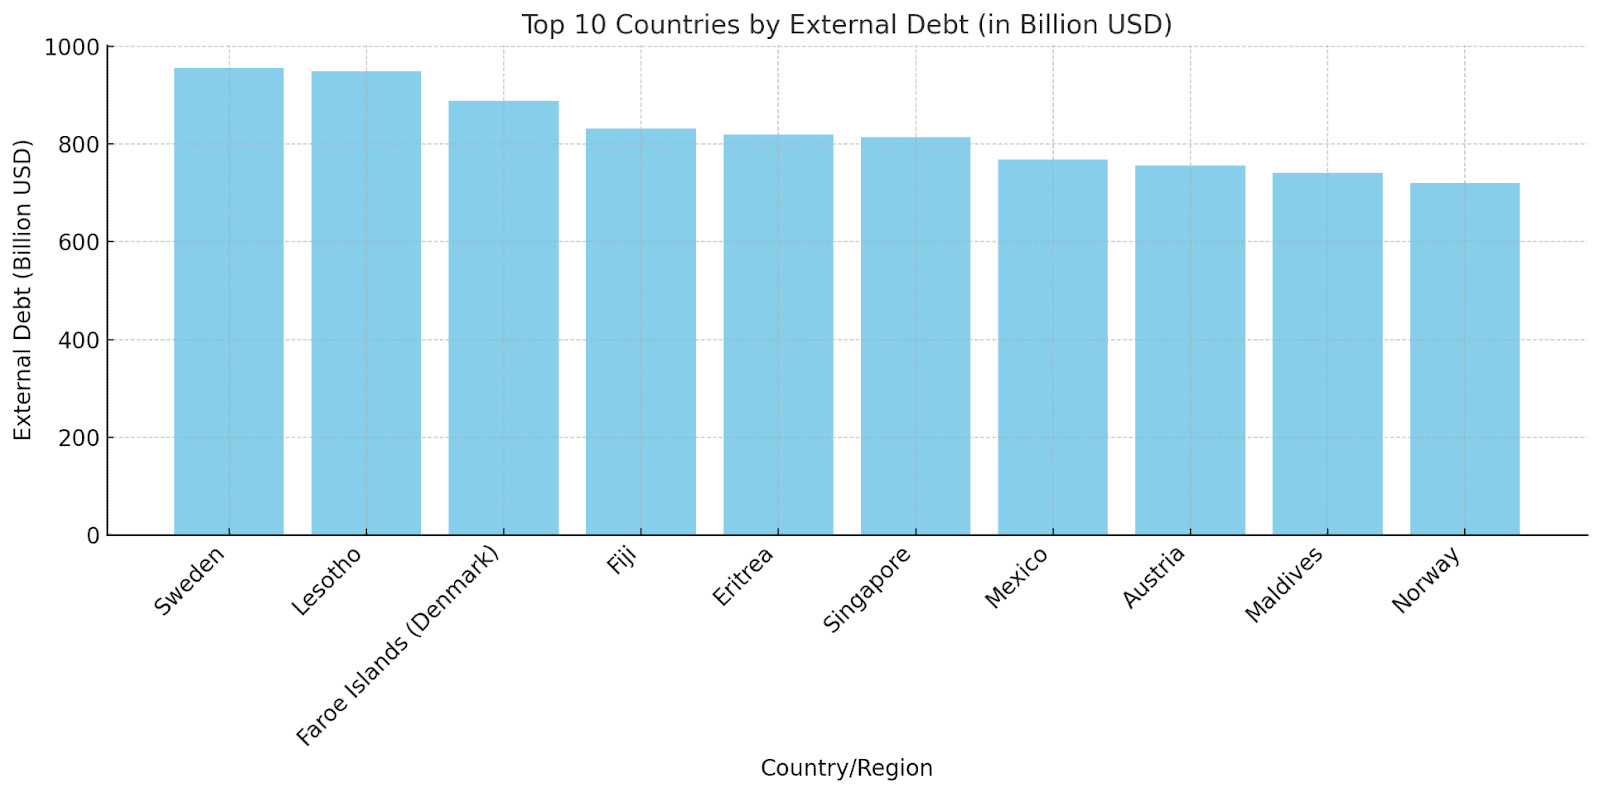
Here is the bar chart showing the top 10 countries by external debt in billion USD. This visualization clearly illustrates the distribution of external debt among these countries, highlighting the differences in their financial obligations.
Per Capita Debt: A Personal Touch
The per capita external debt offers a more personalized perspective, considering the population size. Some small countries, like Monaco and Palau, exhibit surprisingly high figures, indicating a concentration of wealth and unique financial dynamics.
In this garden of economics, per capita debt blossoms like individual flowers. Some, like Monaco’s 846,000 USD, bloom with extravagant grandeur, while others remain modest buds. It’s a garden that tells stories, one citizen at a time.
Debt to GDP Ratio: The Economic Heartbeat
The Debt to GDP ratio pulses like a heartbeat, reflecting the vitality of an economy. With beats ranging from a calm 0% to a frenzied 849%, it sings a song of fiscal health, caution, and sometimes, a cry for attention.
The debt to GDP ratio portrays how a country’s debt compares to its economic output. With figures ranging from 0% to 849%, it highlights the diverse approaches to borrowing and fiscal management across the globe.
Country Highlights: A World Tour of Numbers
A closer look at specific countries uncovers some notable standings: A closer look at Global External Debt
- Highest External Debt: Sweden, Lesotho, Faroe Islands (Denmark), Fiji, Eritrea.
- Highest Per Capita Debt: Palau, Monaco, Malta, Switzerland, Mauritius.
- Highest Debt to GDP Ratio: Cyprus, Ireland, Malta, Switzerland, United Kingdom.
These rankings reveal the complexity of external debt, where size doesn’t always correlate with the amount of debt, and smaller economies can have significant per capita figures.
Embark on a world tour, where numbers become landmarks. Visit Sweden’s towering external debt or explore the luxurious per capita debt of Monaco. Meet the United Kingdom’s robust Debt to GDP ratio, standing tall like a financial Big Ben. Each stop is a new adventure, a new insight.
Special Cases and Anomalies: A Twist in the Tale
Beyond the overall trends, some unique cases stand out with Global External Debt:
- Cyprus: With a debt to GDP ratio of 849%, Cyprus poses an extreme example that warrants further investigation into its economic structure and financial agreements.
- Palau: The high per capita debt in Palau is an anomaly that may be tied to specific investments or the nation’s compact size.
These special cases offer valuable insights into the multifaceted nature of external debt and the importance of contextual understanding.
Every story has its twists, and the tale of external debt is no exception. Cyprus, with its staggering 849% Debt to GDP ratio, becomes an enigma, a mystery wrapped in numbers. Palau’s per capita debt whispers secrets of a unique economic landscape. These twists add spice to our journey, tickling our curiosity.
Comparative Analysis
Here’s what the comparative analysis reveals:
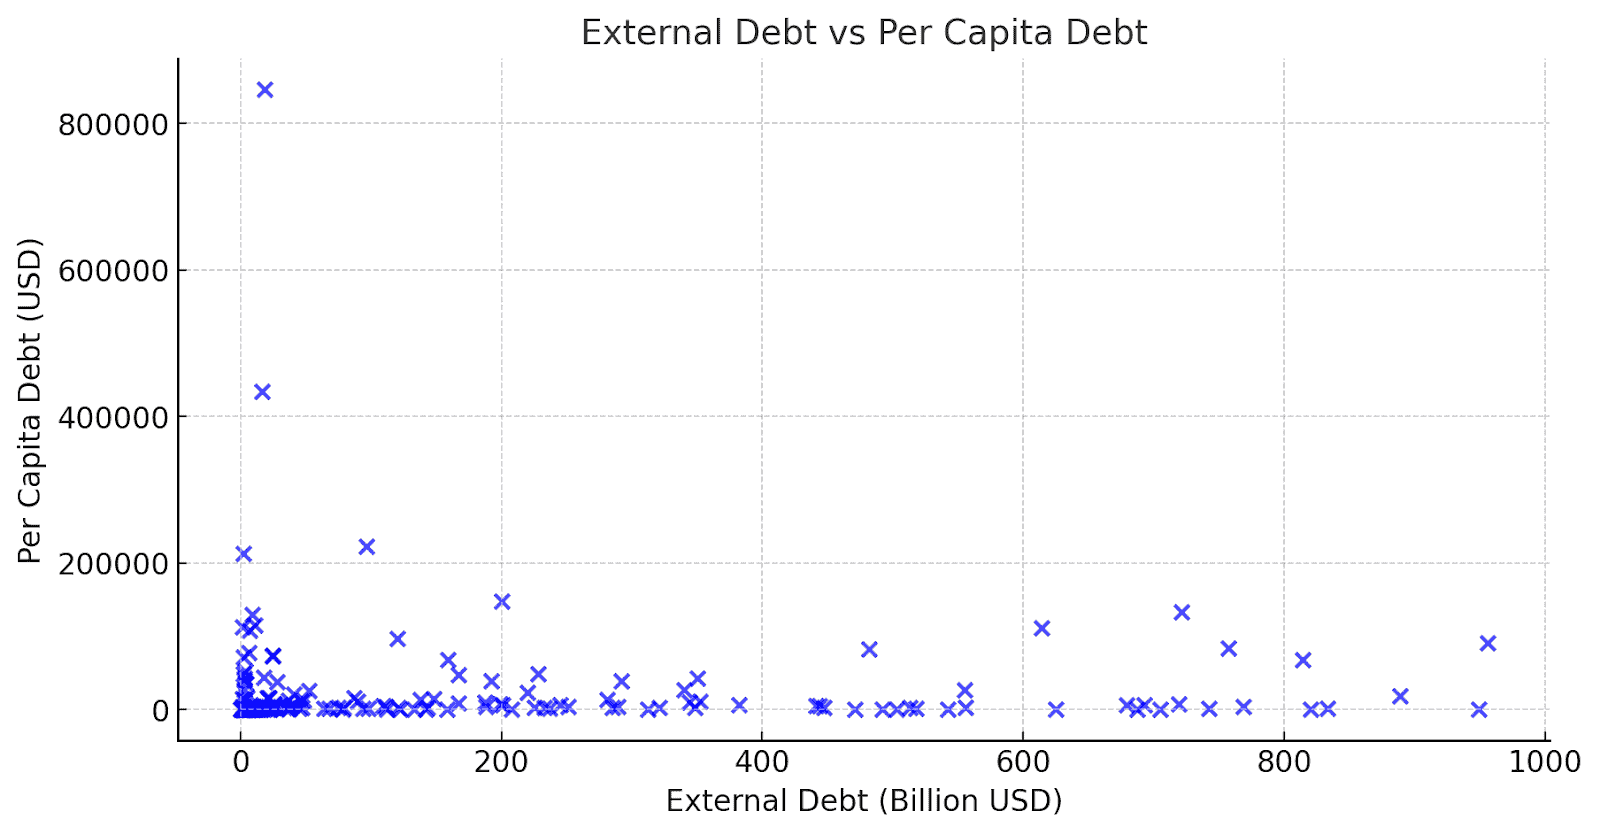
1. External Debt vs Per Capita Debt
- Scatter Plot: The scatter plot shows no strong correlation between a country’s total external debt and its per capita debt. Countries with high total debt don’t necessarily have high per capita debt, and vice versa.
- Interesting Insight: This lack of correlation emphasizes the importance of population size in understanding the personal burden of debt. A country may have a large total debt but distribute it across a vast population, resulting in a lower per capita figure.
2. External Debt vs Debt to GDP Ratio
- Scatter Plot: The plot between external debt and the debt-to-GDP ratio also does not show a strong correlation. Countries with high external debt may have a low or high debt-to-GDP ratio.
- Interesting Insight: This pattern underscores the complexity of the debt-to-GDP ratio, which reflects not only the debt level but also the economic productivity (GDP) of the country. It’s a dance where both partners—the debt and GDP—must be considered.

3. Correlation Matrix:
- External Debt & Per Capita Debt: Correlation of 0.0078, almost no linear relationship.
- External Debt & Debt to GDP Ratio: Correlation of -0.0059, almost no linear relationship.
- Per Capita Debt & Debt to GDP Ratio: Correlation of 0.2960, a mild positive relationship.
Extreme Values
1. External Debt:
- Highest: Sweden leads with 956 billion USD.
- Lowest: Liechtenstein and Niue (New Zealand) stand out with 0 USD in external debt.
2. Per Capita Debt:
- Highest: Monaco’s citizens lead with an astonishing 846,000 USD per capita debt.
- Lowest: Afghanistan, Nigeria, and Burundi have minimal per capita debts ranging from 40 to 60 USD.
3. Debt to GDP Ratio:
- Highest: Cyprus’s 849% Debt to GDP ratio is an eye-catching anomaly.
- Lowest: Liechtenstein, Niue (New Zealand), Turkmenistan, and New Caledonia (France) have ratios as low as 0% to 1%.
Unexpected Combinations
- High External Debt, Low Per Capita Debt: Countries like India, Lesotho, and Eritrea have significant external debts (ranging from 471 to 949 billion USD) but relatively low per capita debts (from 90 to 437 USD).
- High External Debt, Low Debt to GDP Ratio: Turkmenistan, with 503 billion USD external debt, has only a 1% Debt to GDP ratio.
Story Angles from Outliers and Anomalies
The Swedish Surprise
Sweden’s position as the leader in external debt is a surprise that warrants exploration. A deep dive into Sweden’s economic landscape, policies, and the story behind this towering debt could be a fascinating exploration.
Monaco’s Golden Cage
Monaco’s high per capita debt paints a picture of luxury and extravagance but also raises questions. Is this golden cage a symbol of prosperity or a warning sign? An exploration of Monaco’s unique economic environment could unravel this mystery.
Cyprus’s Siren Call
Cyprus’s staggering 849% Debt to GDP ratio is like a siren call, beckoning us to explore deeper. What led to this extreme ratio, and what does it signify for Cyprus and the global economic landscape?
The Paradox of Plenty
Countries like India and Lesotho present a paradox of plenty, with high external debts but low per capita figures. It’s a dance of numbers that tells a story of population dynamics, economic policies, and global positioning.
These outliers and anomalies not only add intriguing facts to the narrative but also open doors to deeper explorations, critical analyses, and human stories.
They invite readers to look beyond the surface, to question the norms, and to embark on an intellectual adventure into the world of global economics.
Uncommon Insights
1. Countries with Minimal External Debt:
- Liechtenstein and Niue (New Zealand): Both have exactly 0 USD in external debt.
- Montserrat (UK), Guinea-Bissau, and Andorra: Each has just over 1 billion USD in external debt.
2. Countries with Minimal Per Capita Debt:
- Liechtenstein and Niue (New Zealand): Again, both have 0 USD per capita debt.
- Afghanistan, Nigeria, and Burundi: These countries have per capita debts of only 40 to 60 USD.
3. Countries with Minimal Debt to GDP Ratio:
- Liechtenstein and Niue (New Zealand): Both have a 0% Debt to GDP ratio.
- Turkmenistan and New Caledonia (France): These regions have only 1% Debt to GDP ratio.
- Nigeria: With just a 2% Debt to GDP ratio.
4. Zero Debt Phenomenon:
- Liechtenstein and Niue (New Zealand): These two regions stand out with 0 USD in external debt, 0 USD per capita debt, and a 0% Debt to GDP ratio.
The Zero Debt Enigma
- A Financial Utopia: Imagine a world where debt is but a fleeting shadow, a distant echo. In the serene landscapes of Liechtenstein and the island haven of Niue (New Zealand), this utopia comes to life. With zero external debt, zero per capita debt, and a debt-to-GDP ratio of precisely 0%, these regions dance to a tune unheard in the global financial symphony.
- The Enigma Unraveled: What sorcery is this, one might ask? The secret lies not in magic but in prudent financial management, robust economic policies, and perhaps a sprinkle of geographical advantage. Liechtenstein’s reputation as a financial center, coupled with Niue’s unique economic structure, paints a canvas where debt simply fades into the background.
- A Lesson in Simplicity: The zero debt phenomenon is more than a curious fact; it’s a beacon, a lighthouse guiding other nations through the turbulent seas of global finance. It whispers a lesson in simplicity, integrity, and balance, a lesson that resonates far beyond the borders of these debt-free havens.
The Underdogs of Debt
- Unsung Heroes: In the grand theater of global finance, some actors take center stage, while others linger in the shadows. Countries like Afghanistan, Nigeria, and Burundi often find themselves overshadowed by challenges and crises. Yet, when it comes to per capita debt, they emerge as unsung heroes, with figures as modest as 40 to 60 USD.
- A Tale of Resilience: This is not a tale of riches but one of resilience, determination, and perhaps a touch of irony. Amidst the struggles and complexities of geopolitics, these nations cling to a thread of financial prudence. It’s a thread that weaves a story, a parable of living within means and prioritizing needs.
- A Mirror to the World: The underdogs of debt don’t just tell their own story; they hold a mirror to the world. They challenge perceptions, break stereotypes, and call for a moment of reflection. In their modesty lies wisdom, a wisdom that resonates with individuals, families, and nations alike.
Small But Mighty
- A Dance of the Little Giants: In a world where size often dictates power, the small territories of Montserrat (UK), Guinea-Bissau, and Andorra defy the norms. With external debts just over 1 billion USD, they pirouette gracefully in the global dance of finance, proving that size isn’t everything.
- The Might of Prudence: Their might lies not in towering skyscrapers or bustling industries but in prudence, agility, and a keen understanding of their unique landscapes. Like a nimble dancer, they navigate the complex choreography of economics, striking a balance that many larger players strive to achieve.
- A Symphony of Lessons: These small but mighty players compose a symphony of lessons for the world. They sing a song of adaptability, innovation, and integrity. In their dance, we find inspiration, a reminder that might isn’t always right, and that sometimes, the most profound lessons come from the most unexpected sources.
These expanded story angles weave the facts and figures into a narrative tapestry, adding depth, color, and humanity to the subject of global external debt. They invite readers to see beyond the numbers, to explore the stories, lessons, and paradoxes that lie beneath.
Conclusion: The Final Act – Global External Debt
The exploration of global external debt uncovers a complex and varied landscape. From the vast differences in total and per capita debt to the unique cases like Cyprus and Palau, the analysis emphasizes the importance of nuanced interpretation.
The findings provide fodder for policymakers, economists, and investors, prompting reflection on financial strategies, risk management, and global interconnectedness.
Future research may delve into the historical trends, regional variations, and the underlying factors that shape these intriguing patterns.
As the curtains close on our exploration, we’re left with a rich tapestry of insights, stories, and lessons. The dance of debt continues, with each country swaying to its unique rhythm.
From the intriguing anomalies to the grand scale, global external debt is more than numbers; it’s a living, breathing entity, a character in the global play of economics.
Appendix: Behind the Scenes with Global External Debt
This analysis utilized data sourced from Wikipedia, as of June and December 2022. The dataset underwent cleaning to ensure accuracy, including the conversion of numeric values and date standardization. Limitations of the analysis include the lack of historical data for time-based trends.

FAQs
What is External Debt? External debt refers to the total money borrowed by a country from foreign lenders, including governments, corporations, and international organizations.
Why is Debt to GDP Ratio Important? The Debt to GDP ratio reflects how a country’s total debt compares to its GDP, providing insights into its ability to repay the debt.
How Does Per Capita Debt Differ from Total External Debt? Per capita debt divides the total external debt by the country’s population, offering a more personalized view of the debt burden.
Regional Clusters
1. Europe:
- Average External Debt: 311.57 billion USD
- Average Per Capita Debt: 86,769 USD
- Average Debt to GDP Ratio: 210.92%
2. Asia:
- Average External Debt: 384.89 billion USD
- Average Per Capita Debt: 15,320 USD
- Average Debt to GDP Ratio: 59.07%
3. North America:
- Average External Debt: 265.57 billion USD
- Average Per Capita Debt: 43,081 USD
- Average Debt to GDP Ratio: 97.03%
4. South America:
- Average External Debt: 238.62 billion USD
- Average Per Capita Debt: 4,551 USD
- Average Debt to GDP Ratio: 53.88%
5. Africa:
- Average External Debt: 84.55 billion USD
- Average Per Capita Debt: 932 USD
- Average Debt to GDP Ratio: 29.75%
6. Oceania:
- Average External Debt: 96.92 billion USD
- Average Per Capita Debt: 55,153 USD
- Average Debt to GDP Ratio: 110%
Economic Clusters
1. High External Debt (Above 75th Percentile):
- Average External Debt: 486.13 billion USD
- Average Per Capita Debt: 20,631 USD
- Average Debt to GDP Ratio: 68.83%
2. Low External Debt (Below 25th Percentile):
- Average External Debt: 2.37 billion USD
- Average Per Capita Debt: 13,809 USD
- Average Debt to GDP Ratio: 60.43%
Story Angles from Clusters
A Tale of Continents
The regional clusters unravel a tale of continents, each dancing to its economic rhythm. Europe’s high per capita debt contrasts sharply with Africa’s modest figures, while Asia’s balance between external debt and Debt to GDP ratio offers a unique perspective. It’s a story of diversity, challenges, and shared experiences.
The Highs and Lows of Debt
The economic clusters of high and low external debt provide a lens to view the world’s financial landscape. The highs and lows of debt are not mere numbers but reflections of policies, economic activities, and global positioning.
A Symphony of Numbers
The clusters form a symphony of numbers, where each note adds depth to the understanding of global external debt. They offer a structured yet nuanced view, a pathway to explore the world’s economics beyond headlines and generalizations.
These clusters invite readers to dive deeper into the world of economics, to explore connections, contrasts, and the human stories behind the numbers. They provide a framework to build engaging narratives, critical analyses, and thought-provoking insights.
Would you like me to integrate these cluster insights into the existing content, or do you have any specific requests or directions for further exploration?
Original source material from Wikipedia